Fair Value Gap: How to Identify Imbalances, Filter Noise and Trade Valid Zones
To master Fair Value Gaps, start by understanding market imbalances, learn the three-candle detection rule, then compare FVGs with order blocks to filter noise.
A Fair Value Gap (FVG) is a price action imbalance occurring when a sharp move leaves a void in the market, meaning buyers or sellers dominated so heavily that orders were not evenly distributed. Unlike a standard price gap seen during market opens, an FVG occurs within active trading hours across three consecutive candles. These zones are not automatic reversal signals, but rather areas of inefficiency that the market often returns to visit.
What Fair Value Gaps Truly Cover in Price Action
A fair value gap represents a moment of extreme displacement where the price moves so rapidly that the market fails to provide a fair opportunity for both buyers and sellers to transact. This creates a vacuum of liquidity. In a balanced market, every price level is touched and traded multiple times, ensuring efficiency. When a surge occurs, it leaves a footprint of inefficiency that acts as a magnet for future price action.
The Imbalance Concept
The core logic rests on the premise that the market seeks equilibrium. A price action imbalance occurs when the speed of the move prevents the “filling” of all available orders at specific price levels. Because the market is designed to facilitate trade, it tends to return to these neglected zones to mitigate the imbalance, effectively “filling” the gap before continuing its primary trend or initiating a reversal.
FVG vs. Standard Price Gaps
Standard gaps are typically found on daily charts when a market opens higher or lower than the previous close, often due to weekend news. An FVG is an intra-day, intra-candle phenomenon. While a standard gap is a jump in price from one session to another, an FVG is a lack of overlap between the wicks of two candles separated by a large, impulsive candle.
How the FVG Mechanism Functions on a Chart
Identifying a gap requires a strict three-candle sequence. The middle candle must be a large, impulsive bar that demonstrates strong momentum. The gap itself is the empty space where the high of the first candle and the low of the third candle (for bullish moves) do not touch or overlap. This void is the zone traders monitor for future price reactions.
Identifying Bullish FVGs
In a bullish scenario, candle one creates a high, candle two is a massive upward surge, and candle three begins. If the low of candle three remains above the high of candle one, a bullish FVG is formed. This indicates that buying pressure was so dominant that price skipped over certain levels, leaving a zone where sellers were completely absent.
Identifying Bearish FVGs
A bearish FVG follows the opposite logic. Candle one establishes a low, candle two crashes downward, and candle three forms. If the high of candle three stays below the low of candle one, a bearish gap exists. This reveals a sudden surge of selling pressure that left a void, which the market may later revisit to find “fair value” before resuming the drop.
The Inverse Fair Value Gap (iFVG)
Within SMC trading, an inverse fair value gap occurs when a previously identified FVG is breached and closed entirely by the price. Instead of acting as a support or resistance zone, the gap “flips.” If a bearish FVG is broken to the upside, it becomes an iFVG, often serving as a new support zone for buyers as the market confirms a shift in momentum.
Real Benefits and Material Limits of Trading Gaps
The primary advantage of these zones is the ability to pinpoint high-probability entry points without chasing the price. Instead of entering during the impulsive move, traders wait for the “revisit.” This allows for a tighter stop-loss placement, usually just outside the gap boundary, improving the risk-to-reward ratio of the trade.
The Logic of the Revisit
The market returns to a bullish and bearish FVG to collect liquidity and fill the void. When price enters the zone, it is essentially returning to a price level where orders were left unfilled. If the overall market structure remains intact, the revisit usually leads to a continuation of the trend, as the market has now achieved the efficiency required to push further.
Why Some Gaps are Ignored by Professionals
Not every gap is filled. In extremely strong trending markets, price may ignore a gap entirely because the momentum is too aggressive for a correction. This is known as “gap running.” Professionals avoid trading every FVG they see, as doing so leads to overtrading. They only focus on gaps that align with a higher-timeframe bias or occur after a significant liquidity sweep.
Comparing FVG with Order Blocks and Liquidity Voids
While gaps are signs of inefficiency, they are often used alongside other structural tools. Order blocks represent the last candle of the opposite color before a strong move, marking where institutional orders were placed. A liquidity void, on the other hand, is a more expansive area of inefficiency, often encompassing several FVGs in a row during a parabolic move.
The following table clarifies the technical differences between these three concepts:
| Tool | Detection Rule | Primary Function | Reliability |
|---|---|---|---|
| FVG | 3-candle non-overlap | Entry trigger | Medium |
| Order Block | Last opposite candle | Structural pivot | High |
| Liquidity Void | Series of gaps | Target area | Medium |
A trader might see an inverse fair value gap as a confirmation that an Order Block has failed, signaling a change in market direction. While the Order Block provides the “where” (the structural zone), the FVG often provides the “when” (the specific entry trigger) as price returns to fill the imbalance.
Who This Price Action Model Suits Best
This model is highly effective for day traders and swing traders who prioritize precision. Because FVGs appear on all timeframes, they are versatile. However, the highest probability setups occur when a lower-timeframe FVG aligns with a higher-timeframe structural zone. A trader who blindly trades 1-minute gaps without looking at the 1-hour trend is likely to encounter noise.
Timeframe Frameworks
The most reliable approach involves a top-down analysis. For example, identifying a daily bias, finding a 4-hour liquidity void, and then using a 15-minute FVG for the actual entry. This ensures that the trade is not just a reaction to a small gap, but a move aligned with institutional flow. For those refining their process, integrating FVGs into a professional trading framework helps in creating a repeatable, backtestable system.
The Validation Checklist
Before executing a trade based on a gap, a rigorous filter is required to avoid “trap” zones:
- Market Structure: Is the price making higher highs (bullish) or lower lows (bearish)?
- Displacement: Was the FVG created by a violent move or a slow drift?
- Liquidity: Did the price sweep a significant high or low before creating the gap?
- Timeframe Alignment: Does the gap align with the bias of a higher timeframe?
- Risk-to-Reward: Is the distance to the stop-loss (gap boundary) reasonable compared to the target?
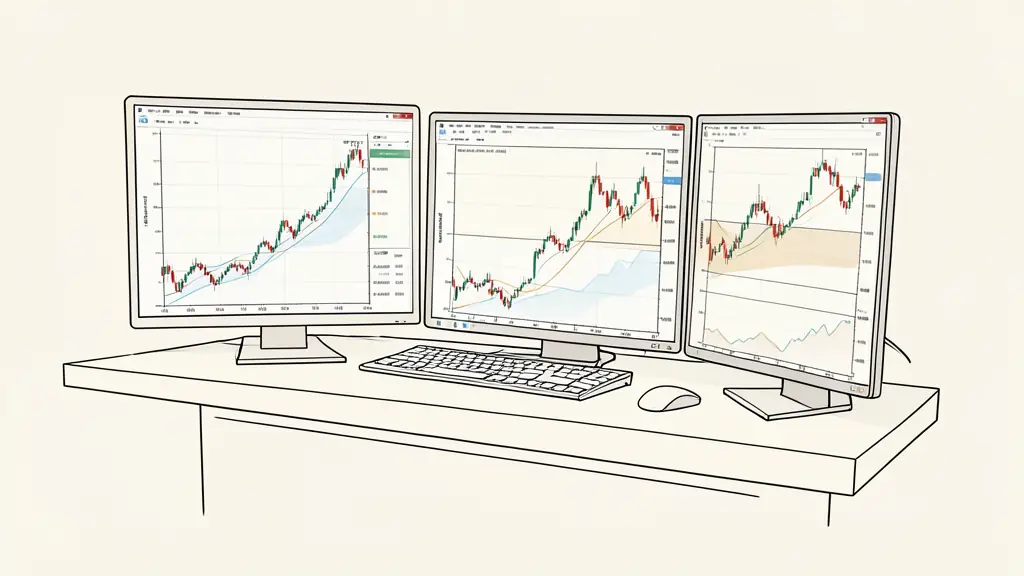
The correct reflex is not to ask “Is there a gap on the chart?” but “Does this gap align with the current market structure and institutional flow?”
This article does not replace advice from a qualified professional: consult a specialist about your own situation.
Risk warning. Trading involves a risk of losing capital. Prop firm challenges are paid and passing them is not guaranteed. This content is for information only and is not investment advice.
Want to go further?
Leave your email and we'll let you know when a new article is out.