How to Trade the Descending Triangle: Identification and Strategy
A comprehensive guide to the descending triangle pattern: learn to spot the setup, confirm the breakout with volume, and set precise price targets.
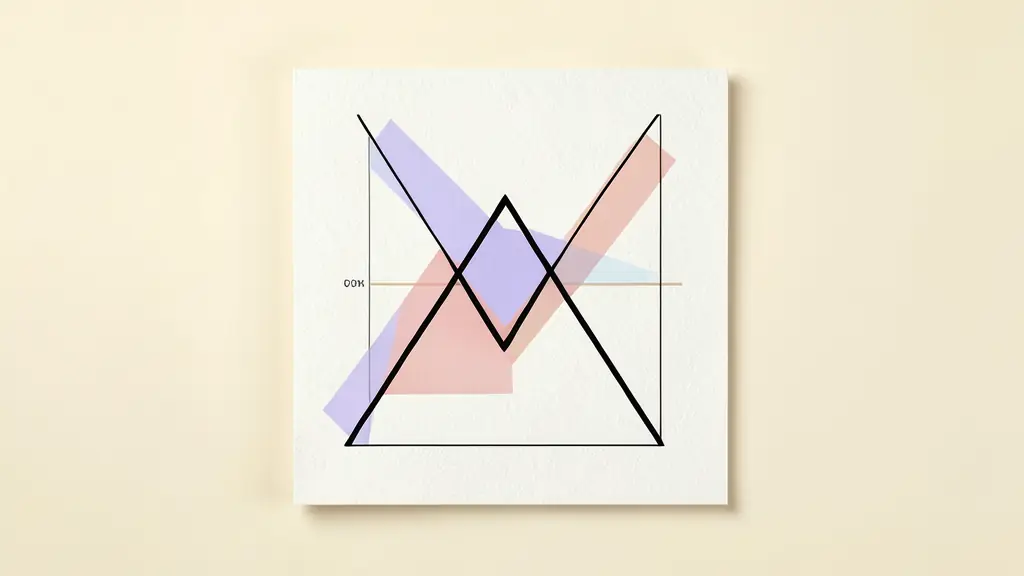
A descending triangle is a bearish technical analysis formation characterized by a flat horizontal support level and a series of lower highs. It signals a period of consolidation where selling pressure gradually increases, typically leading to a downward price breakout.
No time to read?
- Bearish Bias: Characterized by lower highs and a flat support level.
- Volume Clue: Typically decreases during formation and spikes upon breakout.
- Price Target: Measured by the vertical height of the pattern’s widest point.
- Confirmation: A candle close below support is required to avoid false signals.
What Is a Descending Triangle?
The descending triangle is one of the most recognized bearish chart patterns used by traders to anticipate a decline in asset price. Structurally, it represents a psychological battle between buyers and sellers: while buyers are defending a specific price floor (the horizontal support), sellers are becoming more aggressive, pushing the peaks lower with each subsequent rally.
This formation is a sign of distribution, where larger players may be offloading positions into the hands of retail buyers who believe the support level will hold. As the price is squeezed into an increasingly narrow range, the market reaches a tipping point. Although a breakout to the upside is mathematically possible, the canonical outcome is a breakdown to the downside, with a probability of approximately 64%.
How to Identify a Valid Descending Triangle
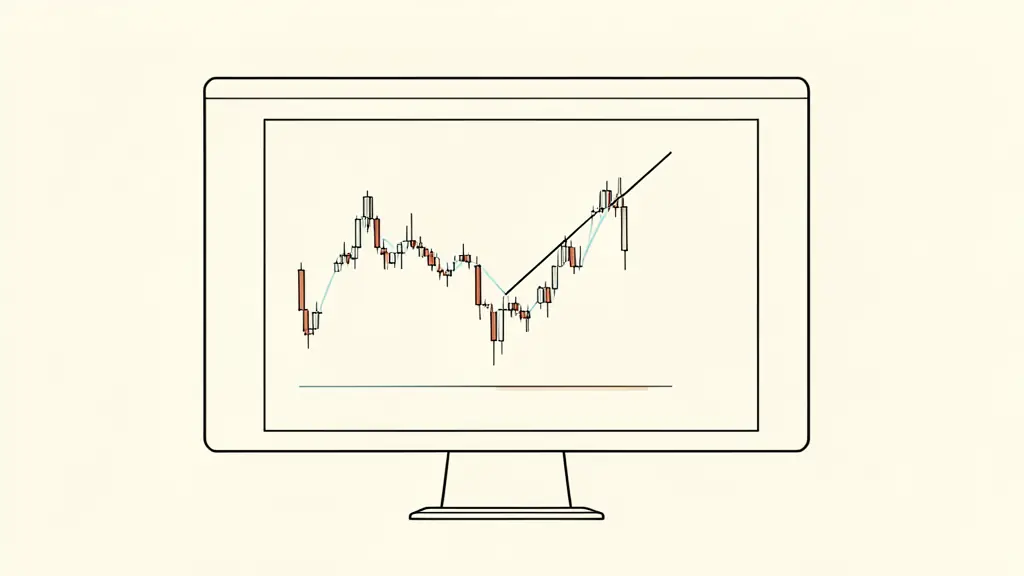
To avoid subjective interpretations, a valid descending triangle must meet specific structural requirements. Identifying these elements is the first step in a disciplined breakout trading strategy.
Structural Requirements
- Horizontal Support Line: The price must establish a clear floor. This requires at least two reaction lows that touch or nearly touch the same price level, indicating a zone of consistent demand.
- Descending Resistance Line: The “ceiling” is formed by connecting two or more declining peaks (reaction highs). Each single peak must be lower than the previous one, confirming that buyers are unable to push the price back to previous highs.
- Convergence: The price action must move within these two boundaries, narrowing the range toward an apex.
The Role of Volume
Volume is a critical filter for validity. During the formation of the triangle, you should typically observe volume contraction. As the price range tightens, trading activity often slows down, reflecting a period of indecision and a lack of conviction from both sides. A valid pattern is not just about the shape of the price action, but the way money flows evolve as the squeeze occurs.
The overall duration of the pattern can vary significantly, ranging from a few weeks to many months, with an average duration of one to three months. However, these patterns can also be identified on shorter timeframes, such as a 60-minute chart.
Trading the Breakout: Entry, Stop-Loss, and Targets
Executing a trade on a descending triangle requires a systematic approach to entry and exit to avoid emotional decision-making.
Entry and Confirmation
The most conservative entry occurs after a confirmed breakdown. This is defined as a candle closing decisively below the horizontal support line. While some traders enter on the initial break, waiting for a candle close reduces the risk of a “fake-out.” For added confirmation, traders often use Heikin Ashi charts or moving averages (such as the 10 and 20 period exponential moving averages) to ensure the trend has shifted.
Price Target Calculation
The price target calculation is based on the “measured move” principle. To project the downside target:
1. Measure the vertical height of the triangle at its widest point (from the horizontal support to the highest reaction high).
2. Subtract this distance from the breakout point on the support line.
For example, consider the Nucor Corp. (NUE) case from December 1999. The stock had support at $45 and had declined from above $60. With a reaction rally just below $50, the initial decline was projected to be 9 points (54 minus 45). This placed the downside projection around $36.
Stop-Loss Placement
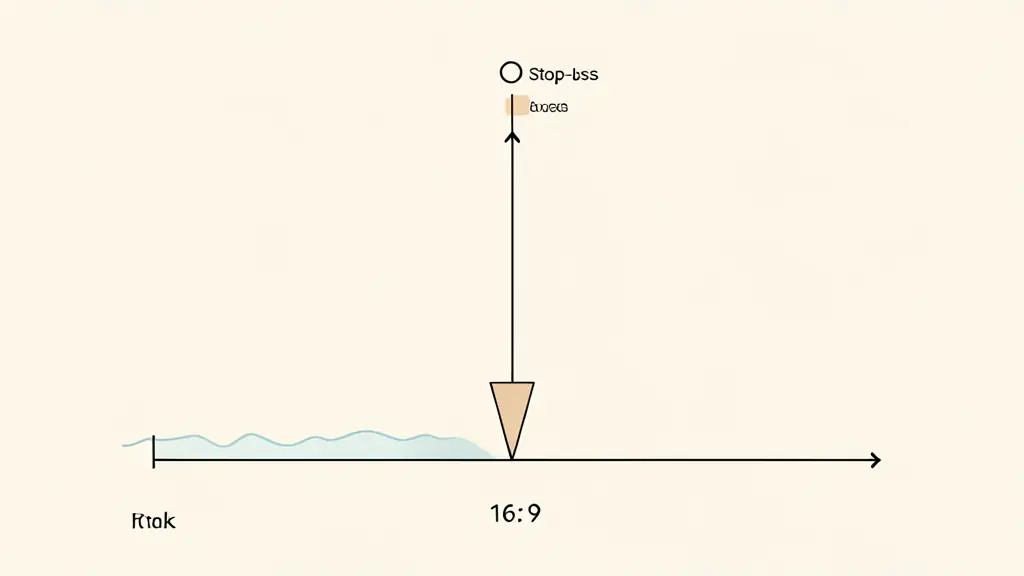
Risk management is paramount. The stop-loss should be placed:
* Above the most recent reaction high (the last lower high).
* Alternatively, just above the descending resistance line.
Continuation vs. Reversal: Which One Is It?
A descending triangle is not always a continuation of an existing trend; its meaning depends entirely on the preceding price action.
Continuation Scenario
When the pattern forms during an existing downtrend, it is a bearish continuation pattern. In this context, the triangle represents a temporary pause or a period of consolidation before the primary bearish trend resumes. The sellers are simply “reloading” before the next leg down.
Reversal Scenario
If the descending triangle appears at the end of a prolonged uptrend, it acts as a reversal pattern. This indicates that the bullish momentum has exhausted and the market is transitioning into a distribution phase.
To differentiate the two, analysts look at technical analysis volume. In a reversal, the volume often shows a distinct shift as the asset moves from accumulation to distribution, signaling that the previous uptrend has lost its fundamental support.
Descending Triangle vs. Descending Wedge
One of the most common mistakes in technical analysis is confusing the descending triangle with the descending wedge. While both feature lower highs, their support structures are fundamentally different.
The triangle features a flat horizontal support, meaning buyers are defending a specific price. The wedge, however, has a sloping support line that moves downward along with the resistance. Because the wedge represents a narrowing of price that often leads to an explosive move in the opposite direction of the slope, it is typically viewed as a bullish reversal setup.
The following table clarifies the descending wedge vs triangle differences:
| Feature | Descending Triangle | Descending Wedge |
|---|---|---|
| Support Line | Horizontal (Flat) | Descending (Sloping) |
| Resistance Line | Descending | Descending |
| Primary Bias | Bearish | Typically Bullish (Reversal) |
| Market Psychology | Consistent demand floor | Weakening bearish momentum |
| Canonical Breakout | Downside | Upside |
Risk Management and False Breakouts
The primary risk when trading this pattern is the “bull trap,” where the price dips below support only to reverse sharply upward. For traders managing funded accounts, these false signals are particularly dangerous as they can lead to rapid losses that threaten daily drawdown limits.
Avoiding False Breakouts
To mitigate this risk, focus on these confirmation steps:
* Volume Expansion: A valid breakdown should be accompanied by a surge in volume. Volume expansion confirms that the move is backed by institutional money flows rather than retail noise.
* Candle Closure: Never enter a trade based on a wick that penetrates support. Wait for the candle to close below the level.
* Institutional Confirmation: Integrating institutional candlestick confirmation can help verify if the breakdown is a genuine shift in sentiment.
* The Retest: A high-probability entry often occurs when the price breaks support, then rallies back to “retest” that same level from below. When the former support becomes resistance, it provides a safer entry point with a tighter stop-loss.
Prop Firm Risk Checklist
- Risk per Trade: Ensure the distance to your stop-loss (the most recent lower high) does not represent an excessive percentage of your account.
- Drawdown Monitoring: If a false breakout occurs, accept the loss immediately. Attempting to “average down” in a failed triangle can lead to a breach of funded account rules.
- Target Realism: Do not rely solely on the measured move. Scale out of positions as the price approaches the target to lock in profits.
This article does not replace advice from a qualified professional: consult a specialist about your own situation.
FAQ
Can a descending triangle be bullish?
While primarily bearish, a breakout to the upside is possible. However, this is considered a failed pattern and typically requires significantly more buying volume to override the established bearish bias.
How do Heikin Ashi charts help with this pattern?
Heikin Ashi charts smooth out price noise, making it easier to visualize the descending trendline and the strength of the breakdown move without being distracted by minor pullbacks.
Want to go further?
Leave your email and we'll let you know when a new article is out.