US30 Forex Trading: The Dow Jones Mechanics, Trading Logic and Risk Framework
To trade US30, understand the Dow Jones price-weighting, compare it with the S&P 500 and NASDAQ, then master the long and short CFD mechanics for safe execution.
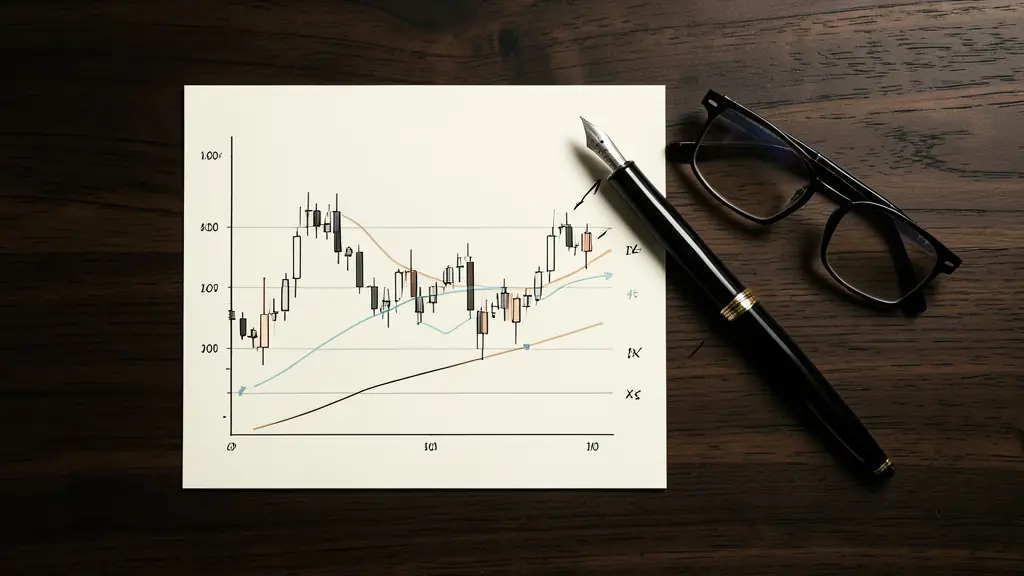
US30 forex trading involves speculating on the price movements of the Dow Jones Industrial Average through a broker symbol. While it offers high volatility attractive to funded traders, the inherent risk of leveraged CFDs can lead to rapid capital depletion. Traders must audit broker spreads and contract sizes before opening a position to ensure risk alignment.
What US30 Forex Trading Truly Covers
The US30 symbol is not a currency pair, despite being listed on many FX platforms. It is a broker ticker used to trade a Contract for Difference (CFD) on the Dow Jones Industrial Average, a legendary benchmark that tracks the performance of 30 prominent US companies. When a trader opens a position on US30, they are not exchanging currencies but speculating on the price direction of an equity index.
The Index vs. The Ticker / Why it is called US30
The distinction between the index and the ticker is fundamental for risk management. The Dow Jones Industrial Average is the underlying mathematical value, while US30 is the tradable instrument provided by the broker. The “US” refers to the United States market, and “30” represents the number of blue-chip stocks that comprise the index.
This instrument allows traders to gain exposure to the broader US economy without purchasing individual shares of every constituent company. Because it is traded as a CFD, the trader does not own the underlying assets but instead enters a contract with the broker to exchange the difference in price from the time the trade is opened to when it is closed.
The Operational Logic: How the US30 Index Works
The Dow Jones operates differently from most modern indices. It is a Price-weighted index, meaning the index value is determined by the sum of the share prices of its constituents divided by a fixed divisor. In this system, companies with higher per-share prices exert a significantly greater influence on the index’s movement than those with lower share prices, regardless of the company’s actual market capitalization.
The Price-Weighted Mechanism
Because the index relies on share price rather than company size, a stock trading at $200 per share has twice the impact of a stock trading at $100 per share. To maintain accuracy during corporate actions, such as stock splits or share issues, the index provider uses a divisor. For example, XTB cited a divisor value of approximately 0.151 as of June 20 to ensure the index remains a consistent reflection of market value despite these changes.
The Role of Blue-Chip Constituents
The index consists of 30 blue-chip stocks, which are large, well-established, and financially sound companies. This designation ensures that the index reflects the health of the US industrial and service sectors, excluding transportation and public utility companies. The concentration of these high-value companies means that the movement of just a few heavyweights can drive the entire index, regardless of how the other 20 or 25 companies are performing.
Real Trading Advantages and Critical Limits
Trading US30 CFDs provides access to some of the highest liquidity in the financial markets. This liquidity allows for precise execution of entries and exits, making it a preferred instrument for those utilizing high-frequency strategies or tight stop-losses. The index often exhibits clear trend structures, allowing traders to identify bullish or bearish continuations with greater confidence than in fragmented currency pairs.
Liquidity and Volatility
The volatility of the US30 is a double-edged sword. While it provides the price movement necessary for significant profit potential, it can also lead to rapid drawdowns. Market sentiment and risk appetite shift quickly, especially during the New York session, which can result in violent price rejections at key support or resistance levels.
Concentration Risk
A primary limit of the US30 is its concentration risk. Because it is not a market-cap-weighted index, a single company with a very high share price can disproportionately move the index. If one blue-chip giant reports poor earnings, the US30 may drop even if the majority of the other 29 companies are stable. This creates a divergence between the index performance and the actual health of the broader US stock market.
Comparing US30 with Other Major US Indices
Traders often confuse the US30 with the S&P 500 or the NASDAQ. The main difference lies in the composition and the weighting methodology. While the US30 focuses on 30 industrial giants, the S&P 500 provides a broader view of 500 companies, and the NASDAQ is heavily skewed toward technology and growth stocks.
The following table compares the structural differences between these three major instruments:
| Index | Weighting Method | Composition | Primary Sector Focus |
|---|---|---|---|
| US30 | Price-Weighted | 30 Blue-Chips | Industrial/Diverse |
| S&P 500 | Market-Cap Weighted | 500 Companies | Broad Market |
| NASDAQ | Market-Cap Weighted | 100+ Companies | Technology/Growth |
These differences dictate how traders approach Long and short positions. A trader bullish on the tech sector will find the NASDAQ more appropriate, while someone betting on the stability of established US industry will favor the US30. Because the US30 is more concentrated, it often reacts more sharply to specific corporate news than the more diversified S&P 500.
The Execution Audit: Who Should Trade US30 and How
Executing a trade on the US30 requires a strict understanding of margin and leverage. For instance, XTB mentions that with 1:20 leverage, a 5% margin is required. This means a trader with 1,000 USD in capital could potentially control a position valued at 20,000 USD. While this amplifies potential returns, it equally increases the risk of loss, making strict risk-to-reward ratios mandatory.
Long vs. Short Mechanics
Traders can express a bullish view by opening a buy position (long trade) or a bearish view via a sell position (short trade). To manage these positions, technical analysts often use the 50-day moving average to determine the trend or Fibonacci retracement levels (such as 0.5, 0.618, and 0.786) to identify potential pullback zones before a bullish or bearish continuation.
Key Market Drivers
Market volatility is primarily driven by macroeconomic releases. The Federal Reserve’s interest-rate expectations and the Consumer Price Index (CPI) are the most influential catalysts. Traders must also monitor the NFP and market impact to anticipate sudden shifts in investor sentiment. Geopolitical risks and quarterly earnings releases from the 30 constituent companies can also trigger breakouts or sharp reversals.
To determine if the US30 fits your profile, consider your trading style. Day traders seeking high volatility and quick price action will find the US30 ideal, provided they can handle the leverage. Swing traders seeking blue-chip stability may prefer it for longer-term trend following.
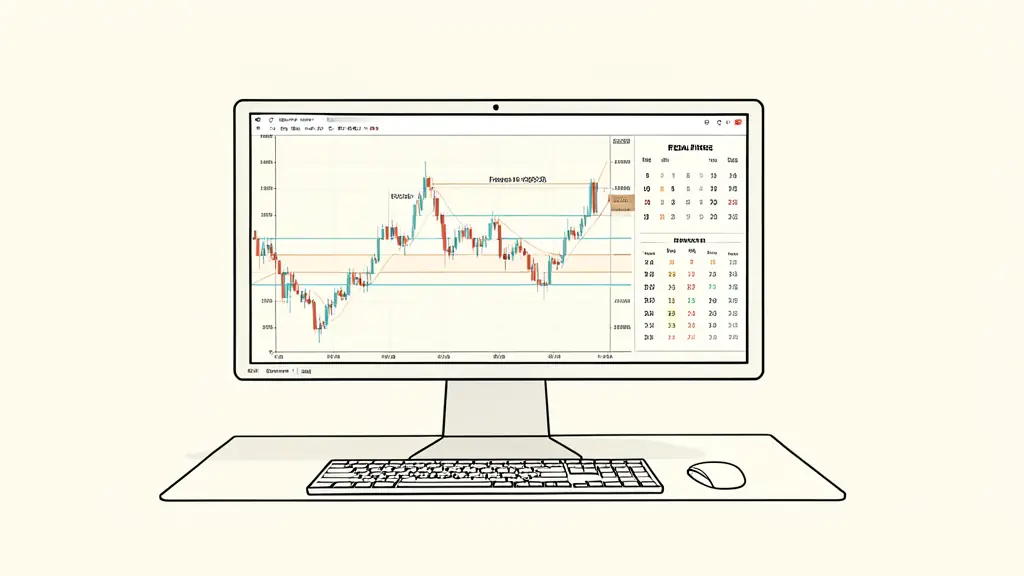
Before executing any trade, verify the following risk parameters:
1. Current bid-ask spread and daily swap points.
2. Margin requirement relative to the account equity.
3. Proximity to high-impact economic releases (CPI, Fed).
4. Alignment of the current price with major support and resistance zones.
The right reflex is not to ask “How much can I make?” but “How much am I willing to lose on this specific volatility spike?”
Risk warning. Trading involves a risk of losing capital. Prop firm challenges are paid and passing them is not guaranteed. This content is for information only and is not investment advice.
Want to go further?
Leave your email and we'll let you know when a new article is out.